Statistics – real and fake – are fired at us in alarming quantities these days: it’s no wonder we now need organisations like Full Fact to wade through data in a bid to fact check political claims. Data analysis, I am discovering, is not for the faint-hearted. It comes as no surprise that ‘housing stock’ and ‘new housing supply’ is measured by DCLG (and a few other parties) in myriad bewildering and conflicting dimensions. That’s my excuse for any errors you may discover in the post below, though I am fairly confident that the ballpark is about the right size.
Let’s start with how much housing gets added to the stock in England each year, and who for.
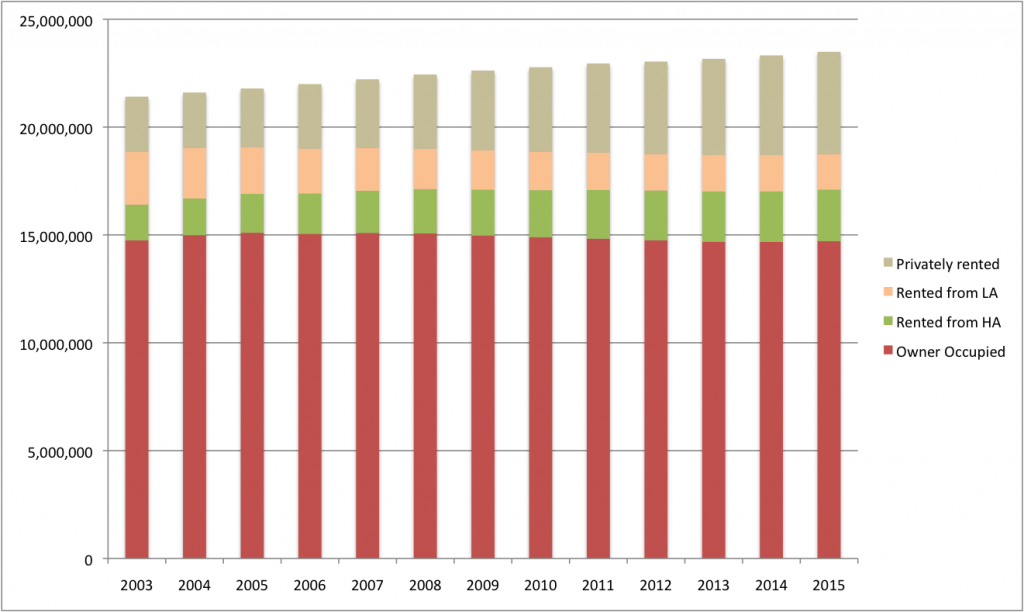
The bald and striking fact visible in this chart is that the 2.1m additional homes delivered in England over the last 12 years (a 10% stock uplift) have not given rise to any more home ownership or any more affordable housing. It’s a fiddly picture: the new builds themselves are a mix of tenures of course, but a combination of Right To Buy (RTB) and Buy To Let (BTL) in both new and existing stock drastically impacts the net outcome (see top diagram). So new housing delivery, in itself, does not appear to deliver what people actually want or need. I had not appreciated the astonishing rise of BTL since 1996: there are now over 2m investors owning about 5m properties in England, and about 50% of new builds are now bought BTL (more like 60% in London). RTB accounts for 50,000 homes switching from council to private ownership every year, with 40% of those now being rented out on the open market. So there are a lot more homes for people to rent now, but they have emerged ‘by accident’: we still aren’t seeing any significant delivery of Private Rented Sector (PRS) homes by institutions. The unofficial ballooning ‘small investor’ PRS sector is providing homes which are not purpose-built, secure or regulated.
Annual new housing delivery stats by DCLG have been called out by the house builders as confusing this year. My best stab at the picture is this: 150,000 new build homes per year on average have been delivered by various parties during 2003-15. [Additional new homes arise due to conversions, but these are partly offset by demolitions, except in the last two years where conversions have added about another 20,000 homes per year to the total.] This is well short of the 250,000 required to meet need, but as we’ve seen, volume isn’t everything…
In part 2 of this post, I’ll explore who has been delivering what, where.


